Fourth quarter revenue increased 9.3% year over year to $121 million
Fourth quarter loss from operations was $12 million; non-GAAP operating income was $22 million
Announced $150 million share repurchase program
Introduced Agentic Artificial Intelligence ("AI") offerings in the PagerDuty Operations Cloud
PagerDuty Announces Fourth Quarter and Full Year Fiscal 2025 Financial Results
Investor Relations Contact:
Tony Righetti
investor@pagerduty.com
A PHP Error was encountered
Severity: Warning
Message: Attempt to read property "image_name" on null
Filename: views/newsdetail_view.php
Line Number: 95
Backtrace:
File: /home/judfadzm/public_html/webinar4demand.com/application/views/newsdetail_view.php
Line: 95
Function: _error_handler
File: /home/judfadzm/public_html/webinar4demand.com/application/controllers/News.php
Line: 83
Function: view
File: /home/judfadzm/public_html/webinar4demand.com/application/controllers/News.php
Line: 16
Function: index
File: /home/judfadzm/public_html/webinar4demand.com/index.php
Line: 317
Function: require_once
SOURCE PagerDuty
PagerDuty, Inc. (NYSE:PD), a leader in digital operations management, today announced financial results for the fourth quarter and full year of fiscal 2025, ended January 31, 2025.
This press release features multimedia. View the full release here: https://www.businesswire.com/news/home/20250313210792/en/
(Graphic: Business Wire)
“Our relentless focus on operational excellence and efficient growth delivered another strong quarter, exceeding both top and bottom line guidance ranges,” said Jennifer Tejada, Chairperson and CEO, PagerDuty. “Our customers continue to prioritize digital operations as mission-critical to their business, and PagerDuty is their trusted partner in driving operational efficiency at scale. This quarter's AI innovation, combined with new features added to all PagerDuty Incident Management packages, positions PagerDuty well to accelerate enterprise momentum in the second half.”
PagerDuty also announced today that its Board of Directors has authorized a new share repurchase program for up to $150 million of common stock.
“PagerDuty continues to demonstrate strong business fundamentals and sustainable free cash flow generation,” said Howard Wilson, Chief Financial Officer, PagerDuty. “This second share repurchase program underscores our ongoing commitment to managing share count growth while reflecting our Board and management team’s continued confidence in our long-term strategy and market opportunity.”
Fourth Quarter Fiscal 2025 Financial Highlights
- Revenue was $121.4 million, an increase of 9.3% year over year.
- Loss from operations was $11.7 million; operating margin was negative 9.6%.
- Non-GAAP operating income was $22.3 million; non-GAAP operating margin was 18.3%.
- Net loss per share attributable to PagerDuty, Inc. common stockholders was $0.12.
- Non-GAAP net income per diluted share attributable to PagerDuty, Inc. common stockholders was $0.22.
- Net cash provided by operating activities was $31.4 million, with free cash flow of $28.6 million.
- Cash, cash equivalents, and investments were $570.8 million as of January 31, 2025.
Full Year Fiscal 2025 Financial Highlights
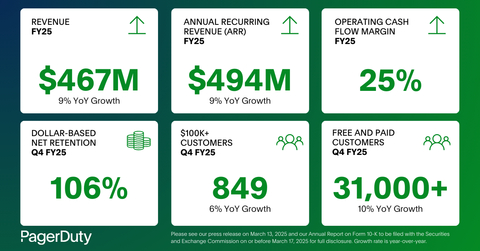
- Revenue was $467.5 million, an increase of 8.5% year over year.
- Loss from operations was $59.8 million; operating margin was negative 12.8%.
- Non-GAAP operating income was $82.7 million; non-GAAP operating margin was 17.7%.
- Net loss per share attributable to PagerDuty, Inc. common stockholders was $0.59.
- Non-GAAP net income per diluted share attributable to PagerDuty, Inc. common stockholders was $0.85.
- Net cash provided by operating activities was $117.9 million, with free cash flow of $108.4 million.
The section titled “Non-GAAP Financial Measures” below contains a description of the non-GAAP financial measures and reconciliations between GAAP and non-GAAP financial information.
Fourth Quarter and Recent Highlights
- Annual recurring revenue ("ARR") as of January 31, 2025 grew 9% year over year to $494 million.
- Customers with ARR over $100 thousand grew 6% to 849 as of January 31, 2025, compared to 804 in the prior year.
- Dollar-based net retention rate was 106% as of January 31, 2025, compared to 107% in the prior year.
- Free and paid customers totaled more than 31,000 as of January 31, 2025 representing approximately 10% growth year over year.
- Total paid customers were 15,114 as of January 31, 2025, compared to 15,039 in the prior year.
- Remaining performance obligations were $440 million as of January 31, 2025. Of this amount, the Company expects to recognize revenue of approximately $302 million, or 69%, over the next 12 months with the balance to be recognized as revenue thereafter.(1)
- Announced upcoming Agentic AI offering including Agentic Site Reliability Engineer, Operational Insights, and Scheduling Optimization Agents as well as AI use case library.
- Introduced new generative AI and automation features of PagerDuty Advance, which is embedded across the PagerDuty Operations Cloud platform, in collaboration with Amazon Web Services.
- Published the 2025 State of Digital Operations Report, a global survey of 1,100+ information technology ("IT") and business leaders asking about the latest opportunities around operational transformation, AI and automation.
- Named a leader in numerous awards, including Fortune Best Workplaces for Parents, Built In Best Places to Work, 2025 BIG Innovation Awards, and 2024 Forbes CIO Next List.
- Released a research study revealing that 88% of executives expect a major incident in 2025 as large as the July 2024 global IT outage, pointing out the critical nature of PagerDuty.
- Appointed Allison Corley as Chief Customer Officer and David Williams as Senior Vice President of Product.
- Appointed Sarah Franklin to the Board of Directors.
- Lands and expands include: Coreweave Inc., Coupa Software, Inc., Datadirect Networks, Inc., NVIDIA Corporation, Palo Alto Networks, Inc., Pinterest, Inc., Toyota Motors Co., LTD, and Zscaler Inc.
(1)Beginning in the first quarter of fiscal 2025, the Company began to include contracts with an original term of less than 12 months in this disclosure which comprised $128 million of remaining non-cancelable performance obligations as of January 31, 2025. |
Financial Outlook
For the first quarter of fiscal 2026, PagerDuty currently expects:
- Total revenue of $118.0 million - $120.0 million, representing a growth rate of 6% - 8% year over year.
- Non-GAAP net income per diluted share attributable to PagerDuty, Inc. common stockholders of $0.18 - $0.19 assuming approximately 94 million diluted shares and a non-GAAP tax rate of 22%.
For the full fiscal year 2026, PagerDuty currently expects:
- Total revenue of $500.0 million - $507.0 million, representing a growth rate of 7% - 8% year over year.
- Non-GAAP net income per diluted share attributable to PagerDuty, Inc. common stockholders of $0.90 - $0.95 assuming approximately 93 million diluted shares and a non-GAAP tax rate of 22%.
These statements are forward-looking and actual results may differ materially. Please refer to the section titled "Forward-Looking Statements" below for information on the factors that could cause our actual results to differ materially from these forward-looking statements.
PagerDuty has not reconciled its expectations as to non-GAAP net income per share attributable to PagerDuty, Inc. common stockholders to GAAP net loss per share attributable to PagerDuty, Inc. common stockholders because certain reconciling items such as stock-based compensation expense, employer taxes related to employee stock transactions, amortization of debt issuance costs, amortization of acquired intangible assets, acquisition-related expenses, restructuring costs, gains or losses on extinguishment of convertible senior notes, adjustment attributable to redeemable non-controlling interest, and income tax effects and adjustments are out of PagerDuty's control or cannot be reasonably predicted. Accordingly, such reconciliation is not available without unreasonable effort. However, it is important to note that these reconciling items could have a significant effect on PagerDuty's future GAAP results.
Conference Call Information:
PagerDuty will host a conference call and live webcast (Zoom meeting ID 975 4160 6140) for analysts and investors at 2:00 p.m. Pacific Time on March 13, 2025. For audio only, the dial-in number 1-312-626-6799 may be used. This news release with the financial results will be accessible from PagerDuty’s website at investor.pagerduty.com prior to the conference call. A live webcast of the conference call will be accessible from the PagerDuty investor relations website at investor.pagerduty.com.
Supplemental Financial and Other Information:
Supplemental financial and other information can be accessed through PagerDuty’s investor relations website at investor.pagerduty.com. PagerDuty uses the investor relations section on its website as the means of complying with its disclosure obligations under Regulation FD. Accordingly, we recommend that investors monitor PagerDuty’s investor relations website in addition to following PagerDuty’s press releases, SEC filings, social media, including PagerDuty’s LinkedIn account (https://www.linkedin.com/company/482819), X (formerly Twitter) account @pagerduty, the X account @jenntejada and Facebook page (facebook.com/pagerduty), and public conference calls and webcasts.
Forward-Looking Statements
This press release and the related webcast contain “forward-looking statements” within the meaning of the “safe harbor” provisions of the Private Securities Litigation Reform Act of 1995, including but not limited to, statements regarding our future financial and operational performance and outlook, including our financial guidance for the first quarter of and full fiscal year 2026, sustainability of free cash flow generation and long-term operating margin target; market positioning, trends and opportunity; our ability to accelerate enterprise momentum in the second half of fiscal 2026; our ability to achieve our mission to revolutionize operations; our strategic initiatives and the timing of the financial impact of those initiatives; expected demand for and benefits of our offerings; our business strategy and plans, including our ability to expand into new use cases; the impact of our recently-launched solutions; our expectations regarding adoption trends and growth prospects and drivers; and our new share repurchase program. Words such as “expect,” “extend,” “anticipate,” “should,” “believe,” “hope,” “target,” “project,” “accelerate,” “goals,” “estimate,” “potential,” “predict,” “may,” “will,” “might,” “could,” “intend,” “shall” and variations of these terms or the negative of these terms and similar expressions are intended to identify these forward-looking statements. Forward-looking statements are subject to a number of risks and uncertainties, many of which involve factors or circumstances that are beyond our control. Our actual results could differ materially from those stated or implied in forward-looking statements due to a number of factors, including but not limited to, risks and other factors detailed in our Annual Report on Form 10-K/A filed with the Securities and Exchange Commission ("SEC") on March 18, 2024 and our Quarterly Reports on Form 10-Qs filed with the SEC on May 31, 2024, September 4, 2024, and November 27, 2024. Additional information will be made available in our Annual Report on Form 10-K for the year ended January 31, 2025 which is expected to be filed with the SEC shortly after this release and other filings and reports that we may file from time to time with the SEC. In particular, the following risks and uncertainties, among others, could cause results to differ materially from those expressed or implied by such forward-looking statements: our ability to achieve and maintain future profitability; our ability to sustain and manage our growth; our ability to attract new customers and retain and sell additional functionality and services to our existing customers; our dependence on revenue from a single product; our ability to compete effectively in an increasingly competitive market; the impact of seasonality on our business; our ability to adapt and respond effectively to rapidly developing technology; our ability to effectively develop and expand our marketing and sales capacities; our ability to enhance and improve our platform or develop new functionality or use cases; the effect of unfavorable conditions in our industry or the global economy, or reductions in information spending, on our business and results of operations; the accuracy of our estimates of market opportunity and forecasts of market growth; adverse consequences that could result from any compromise of our information technology systems or those of third parties with whom we work or our data; adverse consequences that could result from any interruptions or delays in performance of our service; and our ability to maintain the compatibility of our platform with third party applications that our customers use in their businesses.
Past performance is not necessarily indicative of future results. The forward-looking statements included in this press release and the related webcast represent our views as of the date of this press release and the related webcast. We anticipate that subsequent events and developments will cause our views to change. We undertake no intention or obligation to update or revise any forward-looking statements, whether as a result of new information, future events or otherwise. These forward-looking statements should not be relied upon as representing our views as of any date subsequent to the date of this press release and the related webcast.
About PagerDuty, Inc.
PagerDuty, Inc. (NYSE:PD) is a global leader in digital operations management, enabling customers to achieve operational efficiency at scale with the PagerDuty Operations Cloud. The PagerDuty Operations Cloud combines AIOps, Automation, Customer Service Operations and Incident Management with a powerful generative AI assistant to create a flexible, resilient and scalable platform to increase innovation velocity, grow revenue, reduce cost, and mitigate the risk of operational failure. Nearly half of the Fortune 500 and approximately two thirds of the Fortune 100 rely on PagerDuty as essential infrastructure for the modern enterprise. To learn more and try PagerDuty for free, visit www.pagerduty.com.
The PagerDuty Operations Cloud
The PagerDuty Operations Cloud is the platform for mission-critical, time-critical operations work in the modern enterprise. Through the power of AI and automation, it detects and diagnoses disruptive events, mobilizes the right team members to respond, and streamlines infrastructure and workflows across your digital operations. The Operations Cloud is essential infrastructure for revolutionizing digital operations to compete and win as a modern digital business.
PAGERDUTY, INC. CONSOLIDATED STATEMENTS OF OPERATIONS (in thousands, except per share data) |
|||||||||||||||
|
Three months ended January 31, |
|
Year ended January 31, |
||||||||||||
|
|
2025 |
|
|
|
2024 |
|
|
|
2025 |
|
|
|
2024 |
|
Revenue |
$ |
121,446 |
|
|
$ |
111,117 |
|
|
$ |
467,499 |
|
|
$ |
430,699 |
|
Cost of revenue(1) |
|
19,974 |
|
|
|
20,358 |
|
|
|
79,665 |
|
|
|
77,832 |
|
Gross profit |
|
101,472 |
|
|
|
90,759 |
|
|
|
387,834 |
|
|
|
352,867 |
|
|
|
|
|
|
|
|
|
||||||||
Operating expenses: |
|
|
|
|
|
|
|
||||||||
Research and development(1) |
|
34,611 |
|
|
|
35,548 |
|
|
|
141,489 |
|
|
|
139,769 |
|
Sales and marketing(1) |
|
53,084 |
|
|
|
53,614 |
|
|
|
201,821 |
|
|
|
196,769 |
|
General and administrative(1) |
|
25,496 |
|
|
|
35,028 |
|
|
|
104,296 |
|
|
|
112,575 |
|
Total operating expenses |
|
113,191 |
|
|
|
124,190 |
|
|
|
447,606 |
|
|
|
449,113 |
|
Loss from operations |
|
(11,719 |
) |
|
|
(33,431 |
) |
|
|
(59,772 |
) |
|
|
(96,246 |
) |
|
|
|
|
|
|
|
|
||||||||
Interest income |
|
6,084 |
|
|
|
6,858 |
|
|
|
27,492 |
|
|
|
22,101 |
|
Interest expense |
|
(2,370 |
) |
|
|
(2,316 |
) |
|
|
(9,258 |
) |
|
|
(6,500 |
) |
(Loss) gain on partial extinguishment of convertible senior notes |
|
— |
|
|
|
(271 |
) |
|
|
— |
|
|
|
3,699 |
|
Other (expense) income, net |
|
(427 |
) |
|
|
528 |
|
|
|
(215 |
) |
|
|
(433 |
) |
Loss before (provision for) benefit from income taxes |
|
(8,432 |
) |
|
|
(28,632 |
) |
|
|
(41,753 |
) |
|
|
(77,379 |
) |
(Provision for) benefit from income taxes |
|
(448 |
) |
|
|
(185 |
) |
|
|
(1,783 |
) |
|
|
12 |
|
Net loss |
$ |
(8,880 |
) |
|
$ |
(28,817 |
) |
|
$ |
(43,536 |
) |
|
$ |
(77,367 |
) |
Net loss attributable to redeemable non-controlling interest |
|
(120 |
) |
|
|
(665 |
) |
|
|
(801 |
) |
|
|
(2,178 |
) |
Net loss attributable to PagerDuty, Inc. |
$ |
(8,760 |
) |
|
$ |
(28,152 |
) |
|
$ |
(42,735 |
) |
|
$ |
(75,189 |
) |
Less: Adjustment attributable to redeemable non-controlling interest |
|
1,844 |
|
|
|
2,480 |
|
|
|
11,725 |
|
|
|
6,568 |
|
Net loss attributable to PagerDuty, Inc. common stockholders |
$ |
(10,604 |
) |
|
$ |
(30,632 |
) |
|
$ |
(54,460 |
) |
|
$ |
(81,757 |
) |
|
|
|
|
|
|
|
|
||||||||
Weighted average shares used in calculating net loss per share, basic and diluted |
|
90,422 |
|
|
|
92,168 |
|
|
|
92,000 |
|
|
|
92,341 |
|
Net loss per share, basic and diluted, attributable to PagerDuty, Inc. common stockholders |
$ |
(0.12 |
) |
|
$ |
(0.33 |
) |
|
$ |
(0.59 |
) |
|
$ |
(0.89 |
) |
(1) Includes stock-based compensation expense as follows: |
|||||||||||
|
Three months ended January 31, |
|
Year ended January 31, |
||||||||
|
2025 |
|
2024 |
|
2025 |
|
2024 |
||||
Cost of revenue |
$ |
1,288 |
|
$ |
1,726 |
|
$ |
5,984 |
|
$ |
7,586 |
Research and development |
|
10,051 |
|
|
10,798 |
|
|
44,691 |
|
|
44,800 |
Sales and marketing |
|
7,483 |
|
|
7,983 |
|
|
31,185 |
|
|
30,345 |
General and administrative |
|
10,309 |
|
|
11,735 |
|
|
44,350 |
|
|
44,421 |
Total |
$ |
29,131 |
|
$ |
32,242 |
|
$ |
126,210 |
|
$ |
127,152 |
PAGERDUTY, INC. CONSOLIDATED BALANCE SHEETS (in thousands) |
|||||||
|
January 31, |
||||||
|
|
2025 |
|
|
|
2024 |
|
Assets |
|
|
|
||||
Current assets: |
|
|
|
||||
Cash and cash equivalents |
$ |
346,460 |
|
|
$ |
363,011 |
|
Investments |
|
224,366 |
|
|
|
208,178 |
|
Accounts receivable, net of allowance for credit losses of $1,103 and $1,382 as of January 31, 2025 and January 31, 2024, respectively |
|
107,350 |
|
|
|
100,413 |
|
Deferred contract costs, current |
|
19,787 |
|
|
|
19,502 |
|
Prepaid expenses and other current assets |
|
13,757 |
|
|
|
12,094 |
|
Total current assets |
|
711,720 |
|
|
|
703,198 |
|
Property and equipment, net |
|
21,335 |
|
|
|
17,632 |
|
Deferred contract costs, non-current |
|
25,279 |
|
|
|
25,118 |
|
Lease right-of-use assets |
|
6,806 |
|
|
|
3,789 |
|
Goodwill |
|
137,401 |
|
|
|
137,401 |
|
Intangible assets, net |
|
20,865 |
|
|
|
32,616 |
|
Other assets |
|
3,860 |
|
|
|
5,552 |
|
Total assets |
$ |
927,266 |
|
|
$ |
925,306 |
|
|
|
|
|
||||
Liabilities, redeemable non-controlling interest, and stockholders’ equity |
|
|
|
||||
Current liabilities: |
|
|
|
||||
Accounts payable |
$ |
7,329 |
|
|
$ |
6,242 |
|
Accrued expenses and other current liabilities |
|
20,322 |
|
|
|
15,472 |
|
Accrued compensation |
|
37,505 |
|
|
|
30,239 |
|
Deferred revenue, current |
|
243,269 |
|
|
|
223,522 |
|
Lease liabilities, current |
|
3,307 |
|
|
|
6,180 |
|
Convertible senior notes, net, current |
|
57,426 |
|
|
|
— |
|
Total current liabilities |
|
369,158 |
|
|
|
281,655 |
|
Convertible senior notes, net, non-current |
|
393,282 |
|
|
|
448,030 |
|
Deferred revenue, non-current |
|
2,483 |
|
|
|
4,639 |
|
Lease liabilities, non-current |
|
9,637 |
|
|
|
6,809 |
|
Other liabilities |
|
4,661 |
|
|
|
5,280 |
|
Total liabilities |
|
779,221 |
|
|
|
746,413 |
|
|
|
|
|
||||
Redeemable non-controlling interest |
|
18,217 |
|
|
|
7,293 |
|
|
|
|
|
||||
Stockholders' equity |
|
|
|
||||
Common stock |
|
— |
|
|
|
— |
|
Additional paid-in-capital |
|
725,483 |
|
|
|
774,768 |
|
Accumulated other comprehensive loss |
|
(485 |
) |
|
|
(733 |
) |
Accumulated deficit |
|
(595,170 |
) |
|
|
(552,435 |
) |
Treasury Stock |
|
— |
|
|
|
(50,000 |
) |
Total stockholders’ equity |
|
129,828 |
|
|
|
171,600 |
|
Total liabilities, redeemable non-controlling interest, and stockholders' equity |
$ |
927,266 |
|
|
$ |
925,306 |
|
PAGERDUTY, INC. CONSOLIDATED STATEMENTS OF CASH FLOWS (in thousands) |
|||||||||||||||
|
Three months ended January 31, |
|
Year ended January 31, |
||||||||||||
|
|
2025 |
|
|
|
2024 |
|
|
|
2025 |
|
|
|
2024 |
|
Cash flows from operating activities: |
|
|
|
|
|
|
|
||||||||
Net loss attributable to PagerDuty, Inc. common stockholders |
$ |
(10,604 |
) |
|
$ |
(30,632 |
) |
|
$ |
(54,460 |
) |
|
$ |
(81,757 |
) |
Net loss and adjustment attributable to non-controlling interest |
|
1,724 |
|
|
|
1,815 |
|
|
|
10,924 |
|
|
|
4,390 |
|
Net loss |
|
(8,880 |
) |
|
|
(28,817 |
) |
|
|
(43,536 |
) |
|
|
(77,367 |
) |
Adjustments to reconcile net loss to net cash provided by operating activities: |
|
|
|
|
|
|
|
||||||||
Depreciation and amortization |
|
5,077 |
|
|
|
5,137 |
|
|
|
20,603 |
|
|
|
20,153 |
|
Amortization of deferred contract costs |
|
5,747 |
|
|
|
5,282 |
|
|
|
22,008 |
|
|
|
20,568 |
|
Amortization of debt issuance costs |
|
679 |
|
|
|
622 |
|
|
|
2,629 |
|
|
|
2,078 |
|
Loss (gain) on extinguishment of convertible senior notes |
|
— |
|
|
|
271 |
|
|
|
— |
|
|
|
(3,699 |
) |
Stock-based compensation |
|
29,131 |
|
|
|
32,242 |
|
|
|
126,210 |
|
|
|
127,152 |
|
Non-cash lease expense |
|
515 |
|
|
|
1,014 |
|
|
|
3,053 |
|
|
|
4,439 |
|
Impairment of property and equipment, net and right-of-use assets |
|
— |
|
|
|
7,164 |
|
|
|
— |
|
|
|
8,368 |
|
Tax benefit related to release of valuation allowance |
|
— |
|
|
|
— |
|
|
|
— |
|
|
|
— |
|
Other |
|
(609 |
) |
|
|
(593 |
) |
|
|
(4,461 |
) |
|
|
(3,223 |
) |
Changes in operating assets and liabilities: |
|
|
|
|
|
|
|
||||||||
Accounts receivable |
|
(32,793 |
) |
|
|
(29,645 |
) |
|
|
(8,042 |
) |
|
|
(10,662 |
) |
Deferred contract costs |
|
(7,018 |
) |
|
|
(6,514 |
) |
|
|
(22,459 |
) |
|
|
(18,799 |
) |
Prepaid expenses and other assets |
|
3,149 |
|
|
|
2,674 |
|
|
|
(1,930 |
) |
|
|
— |
|
Accounts payable |
|
537 |
|
|
|
(451 |
) |
|
|
1,140 |
|
|
|
(1,453 |
) |
Accrued expenses and other liabilities |
|
5,486 |
|
|
|
3,378 |
|
|
|
4,184 |
|
|
|
4,145 |
|
Accrued compensation |
|
2,910 |
|
|
|
1,261 |
|
|
|
6,912 |
|
|
|
(11,825 |
) |
Deferred revenue |
|
29,081 |
|
|
|
30,620 |
|
|
|
17,695 |
|
|
|
18,073 |
|
Lease liabilities |
|
(1,610 |
) |
|
|
(1,490 |
) |
|
|
(6,115 |
) |
|
|
(5,974 |
) |
Net cash provided by operating activities |
|
31,402 |
|
|
|
22,155 |
|
|
|
117,891 |
|
|
|
71,974 |
|
Cash flows from investing activities: |
|
|
|
|
|
|
|
||||||||
Purchases of property and equipment |
|
(1,145 |
) |
|
|
(971 |
) |
|
|
(2,791 |
) |
|
|
(2,164 |
) |
Capitalized software costs |
|
(1,667 |
) |
|
|
(1,572 |
) |
|
|
(6,686 |
) |
|
|
(5,384 |
) |
Cash flows related to business combination |
|
— |
|
|
|
(24,071 |
) |
|
|
— |
|
|
|
(24,071 |
) |
Cash flows related to asset acquisition |
|
— |
|
|
|
— |
|
|
|
— |
|
|
|
— |
|
Purchases of available-for-sale investments |
|
(61,593 |
) |
|
|
(64,986 |
) |
|
|
(214,714 |
) |
|
|
(216,970 |
) |
Proceeds from maturities of available-for-sale investments |
|
54,159 |
|
|
|
54,200 |
|
|
|
201,986 |
|
|
|
218,264 |
|
Proceeds from sales of available-for-sale investments |
|
— |
|
|
|
— |
|
|
|
2,237 |
|
|
|
— |
|
Purchases of non-marketable equity investments |
|
— |
|
|
|
— |
|
|
|
— |
|
|
|
(200 |
) |
Net cash used in investing activities |
|
(10,246 |
) |
|
|
(37,400 |
) |
|
|
(19,968 |
) |
|
|
(30,525 |
) |
Cash flows from financing activities: |
|
|
|
|
|
|
|
||||||||
Proceeds from issuance of convertible senior notes, net of issuance costs |
|
— |
|
|
|
(712 |
) |
|
|
(403 |
) |
|
|
390,831 |
|
Purchases of capped calls related to convertible senior notes |
|
— |
|
|
|
— |
|
|
|
— |
|
|
|
(55,102 |
) |
Repurchases of convertible senior notes |
|
— |
|
|
|
(204 |
) |
|
|
— |
|
|
|
(223,675 |
) |
Investment from redeemable non-controlling interest holder |
|
— |
|
|
|
— |
|
|
|
— |
|
|
|
1,781 |
|
Repurchases of common stock |
|
(2,581 |
) |
|
|
— |
|
|
|
(100,104 |
) |
|
|
(50,000 |
) |
Proceeds from employee stock purchase plan |
|
3,256 |
|
|
|
4,002 |
|
|
|
8,991 |
|
|
|
10,294 |
|
Proceeds from issuance of common stock upon exercise of stock options |
|
2,812 |
|
|
|
1,481 |
|
|
|
4,339 |
|
|
|
9,871 |
|
Employee payroll taxes paid related to net share settlement of restricted stock units |
|
(6,302 |
) |
|
|
(6,628 |
) |
|
|
(28,961 |
) |
|
|
(32,400 |
) |
Net cash (used in) provided by financing activities |
|
(2,815 |
) |
|
|
(2,061 |
) |
|
|
(116,138 |
) |
|
|
51,600 |
|
Effects of foreign currency exchange rates on cash, cash equivalents, and restricted cash |
|
(15 |
) |
|
|
50 |
|
|
|
(124 |
) |
|
|
(401 |
) |
Net change in cash, cash equivalents, and restricted cash |
|
18,326 |
|
|
|
(17,256 |
) |
|
|
(18,339 |
) |
|
|
92,648 |
|
Cash, cash equivalents, and restricted cash at beginning of year |
|
330,002 |
|
|
|
383,923 |
|
|
|
366,667 |
|
|
|
274,019 |
|
Cash, cash equivalents, and restricted cash at end of year |
$ |
348,328 |
|
|
$ |
366,667 |
|
|
$ |
348,328 |
|
|
$ |
366,667 |
|
Non-GAAP Financial Measures
This press release and the accompanying tables contain the following non-GAAP financial measures: non-GAAP gross profit, non-GAAP gross margin, non-GAAP research and development, non-GAAP sales and marketing, non-GAAP general and administrative, non-GAAP operating income, non-GAAP operating margin, non-GAAP net income attributable to PagerDuty, Inc. common stockholders, non-GAAP net income per share attributable to PagerDuty, Inc. common stockholders, free cash flow, and free cash flow margin.
PagerDuty believes that non-GAAP financial measures, when taken collectively, may be helpful to investors because they provide consistency and comparability with past financial performance and can assist in comparisons with other companies, some of which use similar non-GAAP financial measures to supplement their GAAP results. The non-GAAP financial information is presented for supplemental informational purposes only, should not be considered a substitute for financial information presented in accordance with GAAP, and may be different from similarly-titled non-GAAP measures used by other companies.
The principal limitation of these non-GAAP financial measures is that they exclude significant expenses and income that are required by GAAP to be recorded in PagerDuty’s financial statements. In addition, they are subject to inherent limitations as they reflect the exercise of judgment by PagerDuty’s management about which expenses and income are excluded or included in determining these non-GAAP financial measures. A reconciliation is provided below for each historical non-GAAP financial measure to the most directly comparable financial measure presented in accordance with GAAP.
Specifically, PagerDuty excludes the following from its historical and prospective non-GAAP financial measures, as applicable:
Stock-based compensation: PagerDuty utilizes stock-based compensation to attract and retain employees. It is principally aimed at aligning their interests with those of its stockholders and at long-term retention, rather than to address operational performance for any particular period. As a result, stock-based compensation expenses vary for reasons that are generally unrelated to financial and operational performance in any particular period.
Employer taxes related to employee stock transactions: PagerDuty views the amount of employer taxes related to its employee stock transactions as an expense that is dependent on its stock price, employee exercise and other award disposition activity, and other factors that are beyond PagerDuty’s control. As a result, employer taxes related to employee stock transactions vary for reasons that are generally unrelated to financial and operational performance in any particular period.
Amortization of acquired intangible assets: PagerDuty views amortization of acquired intangible assets as items arising from pre-acquisition activities determined at the time of an acquisition. While these intangible assets are evaluated for impairment regularly, amortization of the cost of purchased intangibles is an expense that is not typically affected by operations during any particular period.
Acquisition-related expenses: PagerDuty views acquisition-related expenses, such as transaction costs, acquisition-related retention payments, and acquisition-related asset impairment, as events that are not necessarily reflective of operational performance during a period. In particular, PagerDuty believes the consideration of measures that exclude such expenses can assist in the comparison of operational performance in different periods which may or may not include such expenses.
Amortization of debt issuance costs: The imputed interest rates of the Company's convertible senior notes (the "2025 Notes" and the "2028 Notes" or, collectively, the "Notes") was approximately 1.91% for the 2025 Notes and 2.13% for the 2028 Notes. This is a result of the debt issuance costs, which reduce the carrying value of the convertible debt instruments. The debt issuance costs are amortized as interest expense. The expense for the amortization of the debt issuance costs is a non-cash item, and we believe the exclusion of this interest expense will provide for a more useful comparison of our operational performance in different periods.
Restructuring costs: PagerDuty views restructuring costs, such as employee severance-related costs and real estate impairment costs, as events that are not necessarily reflective of operational performance during a period. In particular, PagerDuty believes the consideration of measures that exclude such expenses can assist in the comparison of operational performance in different periods which may or may not include such expenses.
Gains (or losses) on partial extinguishment of convertible senior notes: PagerDuty views gains (or losses) on partial extinguishment of debt as events that are not necessarily reflective of operational performance during a period. PagerDuty believes that the consideration of measures that exclude such gain (or loss) impact can assist in the comparison of operational performance in different periods which may or may not include such gains (or losses).
Adjustment attributable to redeemable non-controlling interest: PagerDuty adjusts the value of redeemable non-controlling interest of its joint venture PagerDuty K.K. according to the operating agreement. PagerDuty believes this adjustment is not reflective of operational performance during a period and exclusion of such adjustments can assist in comparison of operational performance in different periods.
Income tax effects and adjustments: For fiscal 2025, PagerDuty used a projected non-GAAP tax rate of 23%. Based on PagerDuty's financial outlook for the first quarter of and full year fiscal 2026, PagerDuty will utilize a projected non-GAAP tax rate of 22% in order to provide better consistency across the interim reporting periods by eliminating the impact of non-recurring and period specific items, which can vary in size and frequency. PagerDuty's estimated tax rate on non-GAAP income is determined annually and may be adjusted during the year to take into account events or trends that PagerDuty believes materially impact the estimated annual rate including, but not limited to, significant changes resulting from tax legislation, material changes in the geographic mix of revenue and expenses and other significant events.
Non-GAAP gross profit and non-GAAP gross margin
We define non-GAAP gross profit as gross profit excluding the following expenses typically included in cost of revenue: stock-based compensation expense, employer taxes related to employee stock transactions, amortization of acquired intangible assets, and restructuring costs. We define non-GAAP gross margin as non-GAAP gross profit as a percentage of revenue.
Non-GAAP operating expenses
We define non-GAAP operating expenses as operating expenses excluding stock-based compensation expense, employer taxes related to employee stock transactions, amortization of acquired intangible assets, acquisition-related expenses, which include transaction costs, acquisition-related retention payments, and asset impairment, and restructuring costs which are not necessarily reflective of operational performance during a given period.
Non-GAAP operating income and non-GAAP operating margin
We define non-GAAP operating income as loss from operations excluding stock-based compensation expense, employer taxes related to employee stock transactions, amortization of acquired intangible assets, acquisition-related expenses, which include transaction costs, acquisition-related retention payments, and asset impairment, and restructuring costs which are not necessarily reflective of operational performance during a given period. We define non-GAAP operating margin as non-GAAP operating income as a percentage of revenue.
Non-GAAP net income attributable to PagerDuty, Inc. common stockholders
We define non-GAAP net income attributable to PagerDuty, Inc. common stockholders as net loss attributable to PagerDuty, Inc. common stockholders excluding stock-based compensation expense, employer taxes related to employee stock transactions, amortization of debt issuance costs, amortization of acquired intangible assets, acquisition-related expenses, which include transaction costs, acquisition-related retention payments and asset impairment, restructuring costs, gain on extinguishment of convertible senior notes, adjustment attributable to redeemable non-controlling interest, and income tax adjustments, which are not necessarily reflective of operational performance during a given period.
Non-GAAP net income per share, basic and diluted
We define non-GAAP net income per share, basic as non-GAAP net income attributable to PagerDuty, Inc. common stockholders divided by weighted average shares outstanding at the end of the reporting period. We define non-GAAP net income per share, diluted as non-GAAP net income attributable to PagerDuty, Inc. common stockholders divided by weighted average diluted shares outstanding at the end of the reporting period.
Free cash flow and free cash flow margin
We define free cash flow as net cash provided by operating activities, less cash used for purchases of property and equipment and capitalization of internal-use software costs. We define free cash flow margin as free cash flow as a percentage of revenue. In addition to the reasons stated above, we believe that free cash flow is useful to investors as a liquidity measure because it measures our ability to generate or use cash in excess of our capital investments in property and equipment in order to enhance the strength of our balance sheet and further invest in our business and potential strategic initiatives. A limitation of the utility of free cash flow as a measure of our liquidity is that it does not represent the total increase or decrease in our cash balance for the period. We use free cash flow in conjunction with traditional U.S. GAAP measures as part of our overall assessment of our liquidity, including the preparation of our annual operating budget and quarterly forecasts and to evaluate the effectiveness of our business strategies. There are a number of limitations related to the use of free cash flow as compared to net cash provided by operating activities, including that free cash flow includes capital expenditures, the benefits of which are realized in periods subsequent to those when expenditures are made.
PagerDuty encourages investors to review the related GAAP financial measures and the reconciliation of these non-GAAP financial measures to their most directly comparable GAAP financial measures, which it includes in press releases announcing quarterly financial results, including this press release, and not to rely on any single financial measure to evaluate PagerDuty’s business.
Please see the reconciliation tables at the end of this release for the reconciliation of non-GAAP financial measures to their most-comparable GAAP financial measures.
PAGERDUTY, INC. RECONCILIATION OF GAAP TO NON-GAAP FINANCIAL MEASURES (in thousands, except percentages and per share data) (unaudited) |
|||||||||||||||
|
Three months ended January 31, |
|
Year ended January 31, |
||||||||||||
|
|
2025 |
|
|
|
2024 |
|
|
|
2025 |
|
|
|
2024 |
|
Non-GAAP gross profit and non-GAAP gross margin |
|
|
|
|
|
|
|
||||||||
Gross profit |
$ |
101,472 |
|
|
$ |
90,759 |
|
|
$ |
387,834 |
|
|
$ |
352,867 |
|
Add: |
|
|
|
|
|
|
|
||||||||
Stock-based compensation |
|
1,288 |
|
|
|
1,726 |
|
|
|
5,984 |
|
|
|
7,586 |
|
Employer taxes related to employee stock transactions |
|
50 |
|
|
|
61 |
|
|
|
162 |
|
|
|
199 |
|
Amortization of acquired intangible assets |
|
2,200 |
|
|
|
2,354 |
|
|
|
9,075 |
|
|
|
8,614 |
|
Restructuring costs |
|
— |
|
|
|
— |
|
|
|
(2 |
) |
|
|
137 |
|
Non-GAAP gross profit |
$ |
105,010 |
|
|
$ |
94,900 |
|
|
$ |
403,053 |
|
|
$ |
369,403 |
|
|
|
|
|
|
|
|
|
||||||||
Revenue |
$ |
121,446 |
|
|
$ |
111,117 |
|
|
$ |
467,499 |
|
|
$ |
430,699 |
|
Gross margin |
|
83.6 |
% |
|
|
81.7 |
% |
|
|
83.0 |
% |
|
|
81.9 |
% |
Non-GAAP gross margin |
|
86.5 |
% |
|
|
85.4 |
% |
|
|
86.2 |
% |
|
|
85.8 |
% |
|
|
|
|
|
|
|
|
||||||||
Non-GAAP operating expenses |
|
|
|
|
|
|
|
||||||||
Research and development |
$ |
34,611 |
|
|
$ |
35,548 |
|
|
$ |
141,489 |
|
|
$ |
139,769 |
|
Less: |
|
|
|
|
|
|
|
||||||||
Stock-based compensation |
|
10,051 |
|
|
|
10,798 |
|
|
|
44,691 |
|
|
|
44,800 |
|
Employer taxes related to employee stock transactions |
|
425 |
|
|
|
468 |
|
|
|
1,116 |
|
|
|
1,398 |
|
Acquisition-related expenses |
|
228 |
|
|
|
354 |
|
|
|
978 |
|
|
|
838 |
|
Amortization of acquired intangible assets |
|
— |
|
|
|
88 |
|
|
|
116 |
|
|
|
350 |
|
Restructuring costs |
|
426 |
|
|
|
(21 |
) |
|
|
424 |
|
|
|
(26 |
) |
Non-GAAP research and development |
$ |
23,481 |
|
|
$ |
23,861 |
|
|
$ |
94,164 |
|
|
$ |
92,409 |
|
|
|
|
|
|
|
|
|
||||||||
Sales and marketing |
$ |
53,084 |
|
|
$ |
53,614 |
|
|
$ |
201,821 |
|
|
$ |
196,769 |
|
Less: |
|
|
|
|
|
|
|
||||||||
Stock-based compensation |
|
7,483 |
|
|
|
7,983 |
|
|
|
31,185 |
|
|
|
30,345 |
|
Employer taxes related to employee stock transactions |
|
310 |
|
|
|
330 |
|
|
|
773 |
|
|
|
919 |
|
Amortization of acquired intangible assets |
|
633 |
|
|
|
629 |
|
|
|
2,530 |
|
|
|
2,459 |
|
Restructuring costs |
|
150 |
|
|
|
— |
|
|
|
140 |
|
|
|
(49 |
) |
Non-GAAP sales and marketing |
$ |
44,508 |
|
|
$ |
44,672 |
|
|
$ |
167,193 |
|
|
$ |
163,095 |
|
|
|
|
|
|
|
|
|
||||||||
General and administrative |
$ |
25,496 |
|
|
$ |
35,028 |
|
|
$ |
104,296 |
|
|
$ |
112,575 |
|
Less: |
|
|
|
|
|
|
|
||||||||
Stock-based compensation |
|
10,309 |
|
|
|
11,735 |
|
|
|
44,350 |
|
|
|
44,421 |
|
Employer taxes related to employee stock transactions |
|
282 |
|
|
|
324 |
|
|
|
745 |
|
|
|
982 |
|
Acquisition-related expenses |
|
— |
|
|
|
432 |
|
|
|
(1 |
) |
|
|
962 |
|
Amortization of acquired intangible assets |
|
— |
|
|
|
22 |
|
|
|
29 |
|
|
|
87 |
|
Restructuring costs |
|
156 |
|
|
|
7,164 |
|
|
|
180 |
|
|
|
8,615 |
|
Non-GAAP general and administrative |
$ |
14,749 |
|
|
$ |
15,351 |
|
|
$ |
58,993 |
|
|
$ |
57,508 |
|
Note: Certain figures may not sum due to rounding. |
|||||||||||||||
PAGERDUTY, INC. RECONCILIATION OF GAAP TO NON-GAAP FINANCIAL MEASURES (continued) (in thousands, except percentages and per share data) (unaudited) |
|||||||||||||||
|
Three months ended January 31, |
|
Year ended January 31, |
||||||||||||
|
2025 |
|
2024 |
|
2025 |
|
2024 |
||||||||
Non-GAAP operating income and non-GAAP operating margin |
|
|
|
|
|
|
|
||||||||
Loss from operations |
$ |
(11,719 |
) |
|
$ |
(33,431 |
) |
|
$ |
(59,772 |
) |
|
$ |
(96,246 |
) |
Add: |
|
|
|
|
|
|
|
||||||||
Stock-based compensation |
|
29,131 |
|
|
|
32,242 |
|
|
|
126,210 |
|
|
|
127,152 |
|
Employer taxes related to employee stock transactions |
|
1,067 |
|
|
|
1,183 |
|
|
|
2,796 |
|
|
|
3,498 |
|
Acquisition-related expenses |
|
228 |
|
|
|
786 |
|
|
|
977 |
|
|
|
1,800 |
|
Amortization of acquired intangible assets |
|
2,833 |
|
|
|
3,093 |
|
|
|
11,750 |
|
|
|
11,510 |
|
Restructuring costs |
|
732 |
|
|
|
7,143 |
|
|
|
742 |
|
|
|
8,677 |
|
Non-GAAP operating income |
$ |
22,272 |
|
|
$ |
11,016 |
|
|
$ |
82,703 |
|
|
$ |
56,391 |
|
|
|
|
|
|
|
|
|
||||||||
Revenue |
$ |
121,446 |
|
|
$ |
111,117 |
|
|
$ |
467,499 |
|
|
$ |
430,699 |
|
Operating margin |
|
(9.6 |
)% |
|
|
(30.1 |
)% |
|
|
(12.8 |
)% |
|
|
(22.3 |
)% |
Non-GAAP operating margin |
|
18.3 |
% |
|
|
9.9 |
% |
|
|
17.7 |
% |
|
|
13.1 |
% |
|
|
|
|
|
|
|
|
||||||||
Non-GAAP net income attributable to PagerDuty, Inc. common stockholders |
|
|
|
|
|
|
|
||||||||
Net loss attributable to PagerDuty, Inc. common stockholders |
$ |
(10,604 |
) |
|
$ |
(30,632 |
) |
|
$ |
(54,460 |
) |
|
$ |
(81,757 |
) |
Add: |
|
|
|
|
|
|
|
||||||||
Stock-based compensation |
|
29,131 |
|
|
|
32,242 |
|
|
|
126,210 |
|
|
|
127,152 |
|
Employer taxes related to employee stock transactions |
|
1,067 |
|
|
|
1,183 |
|
|
|
2,796 |
|
|
|
3,498 |
|
Amortization of debt issuance costs |
|
679 |
|
|
|
622 |
|
|
|
2,629 |
|
|
|
2,078 |
|
Amortization of acquired intangible assets |
|
2,833 |
|
|
|
3,093 |
|
|
|
11,750 |
|
|
|
11,510 |
|
Acquisition-related expenses |
|
228 |
|
|
|
786 |
|
|
|
977 |
|
|
|
1,800 |
|
Restructuring costs |
|
732 |
|
|
|
7,143 |
|
|
|
742 |
|
|
|
8,677 |
|
Loss (gain) on extinguishment of convertible senior notes |
|
— |
|
|
|
271 |
|
|
|
— |
|
|
|
(3,699 |
) |
Adjustment attributable to redeemable non-controlling interest |
|
1,844 |
|
|
|
2,480 |
|
|
|
11,725 |
|
|
|
6,568 |
|
Income tax effects and adjustments |
|
(5,587 |
) |
|
|
(1,353 |
) |
|
|
(21,989 |
) |
|
|
(3,273 |
) |
Non-GAAP net income attributable to PagerDuty, Inc. common stockholders |
$ |
20,323 |
|
|
$ |
15,835 |
|
|
$ |
80,380 |
|
|
$ |
72,554 |
|
|
|
|
|
|
|
|
|
||||||||
Non-GAAP net income per share, basic |
|
|
|
|
|
|
|
||||||||
Net loss per share, basic, attributable to PagerDuty, Inc. common stockholders |
$ |
(0.12 |
) |
|
$ |
(0.33 |
) |
|
$ |
(0.59 |
) |
|
$ |
(0.89 |
) |
Non-GAAP adjustments to net loss attributable to PagerDuty, Inc. common stockholders |
|
0.34 |
|
|
|
0.50 |
|
|
|
1.46 |
|
|
|
1.68 |
|
Non-GAAP net income per share, basic, attributable to PagerDuty, Inc. common stockholders |
$ |
0.22 |
|
|
$ |
0.17 |
|
|
$ |
0.87 |
|
|
$ |
0.79 |
|
|
|
|
|
|
|
|
|
||||||||
Non-GAAP net income per share, diluted(1) |
|
|
|
|
|
|
|
||||||||
Net loss per share, diluted, attributable to PagerDuty, Inc. common stockholders |
$ |
(0.12 |
) |
|
$ |
(0.33 |
) |
|
$ |
(0.59 |
) |
|
$ |
(0.89 |
) |
Non-GAAP adjustments to net loss attributable to PagerDuty, Inc. common stockholders |
|
0.34 |
|
|
|
0.50 |
|
|
|
1.44 |
|
|
|
1.63 |
|
Non-GAAP net income per share, diluted, attributable to PagerDuty, Inc. common stockholders |
$ |
0.22 |
|
|
$ |
0.17 |
|
|
$ |
0.85 |
|
|
$ |
0.74 |
|
|
|
|
|
|
|
|
|
||||||||
Weighted-average shares used in calculating net loss per share, basic and diluted |
|
90,422 |
|
|
|
92,168 |
|
|
|
92,000 |
|
|
|
92,341 |
|
|
|
|
|
|
|
|
|
||||||||
Weighted-average shares used in calculating non-GAAP net income per share |
|
|
|
|
|
|
|
||||||||
Basic |
|
90,422 |
|
|
|
92,168 |
|
|
|
92,000 |
|
|
|
92,341 |
|
Diluted |
|
92,999 |
|
|
|
95,192 |
|
|
|
95,060 |
|
|
|
100,941 |
|
Note: Certain figures may not sum due to rounding. |
|||||||||||||||
(1) On October 13, 2023, the Company provided written notice to the trustee and the note holders of the 2025 Notes that it had irrevocably elected to settle the principal amount of its convertible senior notes in cash and pay or deliver, as the case may be, cash, shares of common stock or a combination of cash and shares of common stock, at the Company’s election, in respect to the remainder, if any, of the Company’s conversion obligation in excess of the aggregate principal amount of the 2025 Notes being converted. The company uses the if-converted method to calculate the non-GAAP net income per diluted share attributable to PagerDuty, Inc. related to the convertible notes due 2025 prior to the election on October 13, 2023. As such, approximately 5.0 million shares related to the convertible notes due 2025 were included in the non-GAAP diluted outstanding share number for the twelve months ended January 31, 2024, related to the period prior to the election on October 13, 2023. Similarly, for the twelve months ended January 31, 2024, the numerator used to compute this measure was increased by $2.5 million for after-tax interest expense savings related to our convertible notes. |
|||||||||||||||
PAGERDUTY, INC. RECONCILIATION OF GAAP TO NON-GAAP FINANCIAL MEASURES (continued) (in thousands, except percentages) (unaudited) |
|||||||||||||||
|
Three months ended January 31, |
|
Year ended January 31, |
||||||||||||
|
|
2025 |
|
|
|
2024 |
|
|
|
2025 |
|
|
|
2024 |
|
Free cash flow and free cash flow margin |
|
|
|
|
|
|
|
||||||||
Net cash provided by operating activities |
$ |
31,402 |
|
|
$ |
22,155 |
|
|
$ |
117,891 |
|
|
$ |
71,974 |
|
Purchases of property and equipment |
|
(1,145 |
) |
|
|
(971 |
) |
|
|
(2,791 |
) |
|
|
(2,164 |
) |
Capitalization of software costs |
|
(1,667 |
) |
|
|
(1,572 |
) |
|
|
(6,686 |
) |
|
|
(5,384 |
) |
Free cash flow |
$ |
28,590 |
|
|
$ |
19,612 |
|
|
$ |
108,414 |
|
|
$ |
64,426 |
|
Net cash used in investing activities |
$ |
(10,246 |
) |
|
$ |
(37,400 |
) |
|
$ |
(19,968 |
) |
|
$ |
(30,525 |
) |
Net cash (used in) provided by financing activities |
$ |
(2,815 |
) |
|
$ |
(2,061 |
) |
|
$ |
(116,138 |
) |
|
$ |
51,600 |
|
|
|
|
|
|
|
|
|
||||||||
Revenue |
$ |
121,446 |
|
|
$ |
111,117 |
|
|
$ |
467,499 |
|
|
$ |
430,699 |
|
Operating cash flow margin |
|
25.9 |
% |
|
|
19.9 |
% |
|
|
25.2 |
% |
|
|
16.7 |
% |
Free cash flow margin |
|
23.5 |
% |
|
|
17.6 |
% |
|
|
23.2 |
% |
|
|
15.0 |
% |
View source version on businesswire.com: https://www.businesswire.com/news/home/20250313210792/en/